 Just one week to go until the General and Local elections, which in the district I work in means one Parliamentary*, 19 district and four parish polls.
Working with elections, graphics, web and mapping colleagues, we wanted to pull together some useful tools to help local voters. Looking at what other councils have done previously, we plumped for an online polling station finder and infographics showing Parliamentary and District Council candidates and previous results.
Find my polling station
As a rural district, my area is entirely made up of villages. We have 120 polling stations, but only one location per village as we tend to run double stations. Most stations are in the same place each year, so why the need for a map, especially when we send out polling cards which give all of the relevant information?
- polling cards are often mislaid so it helps voters to easily find out where their polling station is
- we want to help dispell the assumption that you need your polling card to be able to vote
- there are always new people moving into villages who may not know where the station usually is
- polling stations do sometimes move – three are in diferent locations this year
- there are up to three polls to vote in depending on which village you live in – the map tells you which polls are being held in each village, which is especially useful as residents vote in two different parliamentary constituencies
You can find the map here – covering the whole district. We’re looking forward to seeing how many people use it in the run up to, and on, polling day.
Infographics
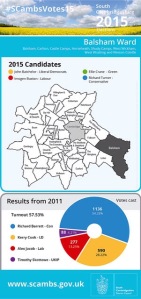
 Information about candidates for all polls is available on the council and other websites, as are details about previous poll results. It’s not all in one place though, so taking a leaf from the fantastic election work from Birmingham City Council’s newsroom over the last few years, we’ve designed infographics for the Parliamentary and District elections.
Each infographic is available on the Council website as PDFs, and via Flickr as image files with a creative commons licence. We’ve also provided them to election count and local media via Dropbox, and sent links to local political bloggers who have kindly shared them with their followers.
Why no infographics for Parish Councils? Logistically, creating them for the four Parish Councils going to poll, and the 28 which have seen candidates elected unopposed, is more difficult:
- candiates tend to stand in just their name without political affiliation
- there are many candidates for many seats – often more than ten at a time
- many are elected unopposed, so there is not always comparative voting data to display.
We have still made candidate information available, but via the standard electoral Statement of Persons Nominated and Declaration of Results. It may be that we’ll come up with a more user-friendly way to do this in the future.
Images: infographics from South Cambridgeshire District Council’s Flickr stream
*When I say one Parliamentary poll, constituency boundaries mean that we deal with one constituency, but only some of our residents vote in it – some vote in the neighbouring constituency which is dealt with by a neighbouring council. And we also take on a ward of yet another council into our constituency.